

The CompTable Platform Advantage
AI assisted operational data ingestion and curated model interpretations.
The Compliance Engine loads the rules in force for your specific state and locality before you build a single model. The AI engine interprets what you want to test, and the math runs deterministically against your roster.

Step 1
Tell us about your business
Share your business type, location and staff roster. CompTable resolves the exact regulatory jurisdiction that applies to you — including any local ordinances that layer on top of state law.

Step 2
Input your current compensation structure
Import a csv file or text prompt your input. The CompTable Ingestion Engine understands hospitality business operations- FOH/BOH distinctions, tipped vs. non-tipped, full-time vs. part-time, and custom headcount splits.

Step 3
The Compliance Engine loads your rules
Before you build a single model, CompTable pre-loads the federal, state, and local regulations for your jurisdiction — minimum wages, tip credit limits, FUTA credit reductions, and any active local ordinances.

Step 4
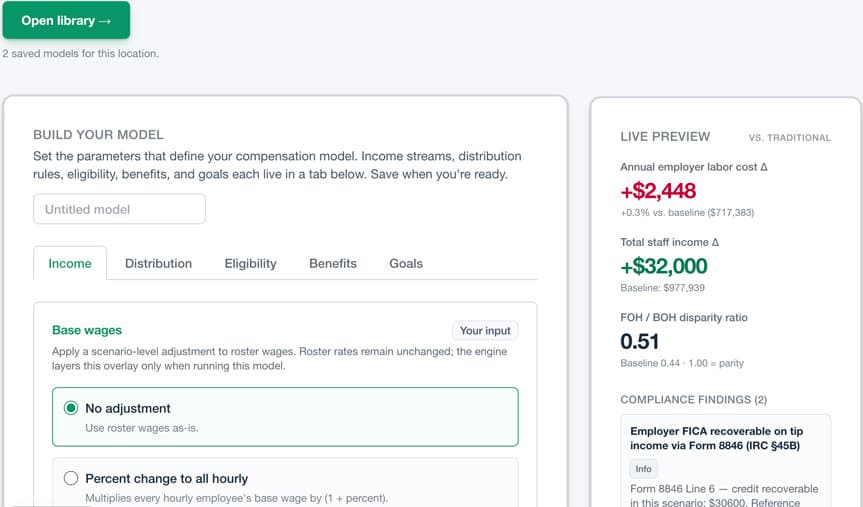
Build Scenarios from scratch or from templates
Describe what you want to the engine: options for overcoming increasing labor costs, you want to offer a staff retention benefit, or incentivize high performers. The AI engine translates your intent into a compliant model structure and pre-fills the parameters that apply to your jurisdiction.
Step 5
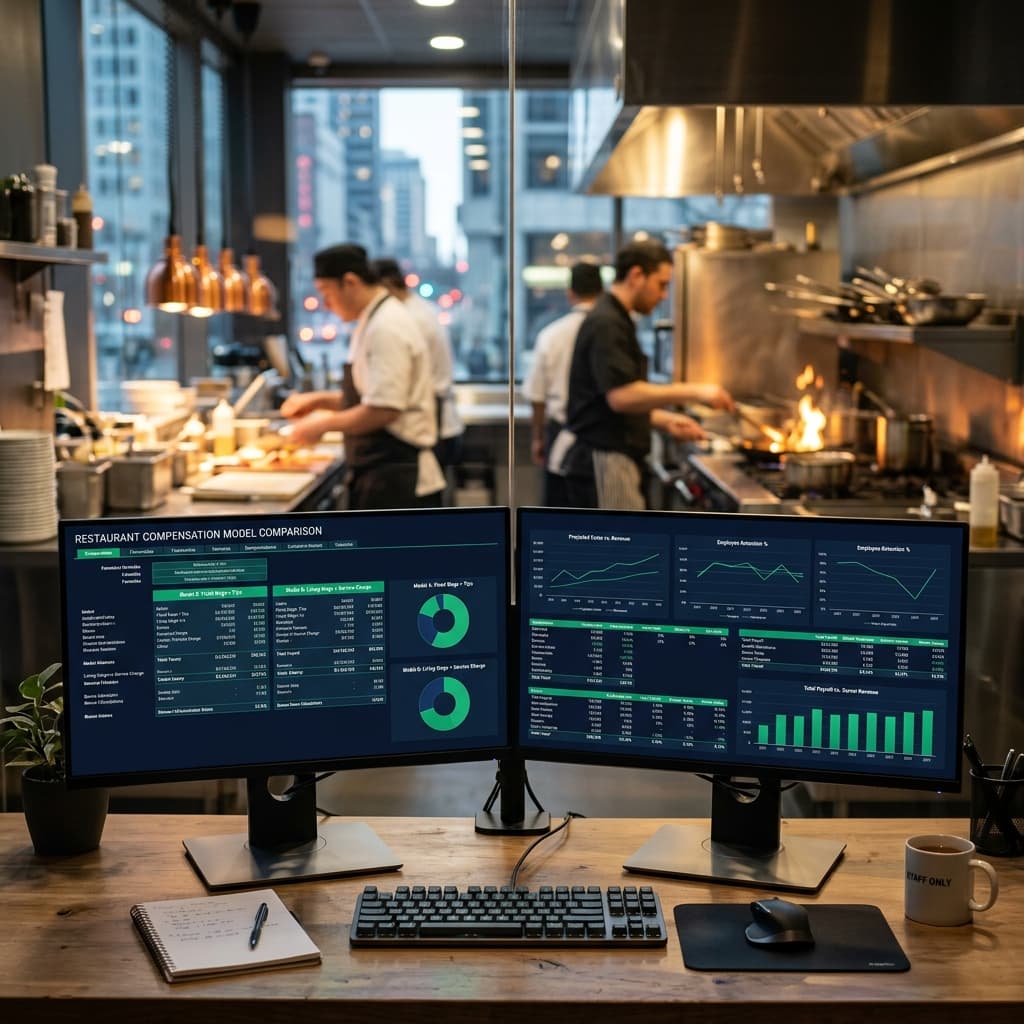
Side by Side Model Comparisons
Your library of scenarios runs against your current payroll baseline. See the full cost delta — labor, benefits, FICA — per employee and in aggregate. Export to PDF for your accountant or investors.
Scenario
Sample figures
Step 6
Set your Working Model.
Apply the scenario you actually run as your Working Model. That model, and only that model, is what The Local Pulse compares. Change it whenever your pay changes; the comparison follows.
Metrics you share
Sample figures
Step 7
See where you stand on The Local Pulse.
Choose the metrics you share. For each one, see your figure beside the median of your Local Group, how many operators are in it, and how wide the comparison reached. Once a month, see which metrics place you in the top quartile toward their goal.
The Local Pulse
Sample figures
Step 8
Connect with a peer, or become one.
Press Request an Insight under any metric to be introduced, privately, to an operator in the top quartile on it. Where you are in the top quartile, open that metric to connect as an Insight Sharer. Every introduction is accepted by the Insight Sharer before anyone’s details are shared.

Step 9
Privacy and Anonymity are strict rules applied to AI assisted tasks and The Local Pulse engine
The AI layer never sees who you are. Names, your business name and your financial identifiers are stripped before anything reaches an AI model. Every dollar is computed by the deterministic engine.
The Local Pulse pool is anonymous. Each Working Model you share adds one row to the Local Groups data set with no name, no roster and no link back to your business. Comparisons appear only when at least ten operators share a Local Group; below that, the tile says so instead of showing a number.
You are identified only when you choose to be. Opening a metric to connect creates one private record tying your business to your value on that metric; it is read only on our servers, never shown to another operator, and deleted when you switch the metric off. Requesting an insight sends your business name and the metric, and nothing else, to one Insight Sharer at a time. Accepting a request as an Insight Sharer sends you the Insight Seeker’s email and phone; they learn who you are when you contact them.
What runs on the CompTable Platform
A Model Generator with built-in simulators,
unmatched flexibility, tools and templates.
POS and Accounting data integrations.
The Model Generator computes the comparable Pro Forma. The sub-models extend it. The tool runs ad-hoc against the current roster. Templates are pre-built scenarios to start from. Every piece runs against your current payroll or any saved scenario.
Core
Model Generator
Loads the federal, state, and local rules in force for your jurisdiction. Applies them to your roster. Produces a comparable Pro Forma against a baseline.
What it produces
- Pro Forma comparisons
- Dashboard and values-driven metrics
- Per-employee differentials
- Compliance findings and system alerts
- AI-assisted data ingestion and narratives
- Math-trails, scenario and library management
- CPA-ready audit exports and account access
Service Charges
Templates Full House Service Charge · BOH-only Service Charge
Inclusive Pricing
Menu Price Surges
Tool Menu Pricing Engine
Unified Tip Pooling: Bridging the FOH/BOH Divide
Templates Full House Tip Pool · Tip Credit Elimination
Labor Optimization and Headcount Reduction
Tool Labor Headroom Solver
Templates
5 itemsTraditional
Tipped minimum wage + tip retention by FOH. The 99% baseline most operators run today.
Full House Service Charge
4-tier point system distributing a single service charge pool across BOH and FOH. Tip credit forfeited.
BOH-only Service Charge
Service charge flows to BOH plus a benefits pool, FOH continues to receive tips. Tip credit retained on FOH.
Full House Tip Pool
Tipped FOH at full minimum wage; pooled tips split 75% FOH / 25% BOH.
Tip Credit Elimination
Models the jurisdiction eliminating the tip credit. Auto-raises tipped FOH base wages to the full state or locality minimum; tips restructure into a Full House Tip Pool.
Sub-models
4 itemsStaff Retention Simulator
Multi-year cashflow projection with retention assumptions. Surfaces break-even month, cumulative savings, and the dominant sensitivity.
Menu Pricing Engine
Inclusive Pricing is the model where the operator raises menu prices to cover the higher base wages paid to the workforce. Translates a labor cost delta into menu price changes by category, under a chosen distribution strategy (maintain margin, prime cost %, target labor %).
Labor Headroom Solver
Inverse constraint solver. Given a fixed menu, searches alternative levers — hours, headcount, wages, bonus, benefits, margin — and returns ranked candidates.
Wage Compression SimulatorTool
Roster-scoped. Given a hypothetical new wage floor, surfaces who falls below it and who collapses into the new-hire band. Tenure-aware when hire dates are present.